
Medical claim denials are easier to address when a practice can see more than the latest rejected claim or unpaid balance. A useful dashboard links denial reasons to payer, specialty, dollars, and resolution status so leaders can identify patterns. Denials do more than delay reimbursement: they create staff rework, make accounts receivable less predictable, and can expose process gaps across registration, coding, documentation, and payer follow-up. Without consistent definitions, different teams may report different results for the same period, making it harder to decide where to intervene first.
A practical medical claim denial root cause analysis dashboard turns claim and remittance data into a repeatable management process. This is the purpose of medical claim denial root cause analysis. The guide explains how to define metrics, group denial reasons, choose dashboard filters, prioritize high-impact causes, and assign corrective actions. The goal is not attractive charts alone; it is a reliable way for revenue-cycle teams to understand patterns, assign owners, and measure whether process changes are working.

Define Denial Metrics Before Building the Dashboard

Define what the dashboard counts. Medical claim denial analytics starts with a clear numerator, denominator, measurement level, and period. Distinguish claims, claim lines, remittances, and dollars.
For an initial claim-level rate, define the numerator as unique initially denied claims and the denominator as claims submitted in the matching cohort. Document how rebills, corrections, voids, partial payments, and duplicate codes are handled. HFMA’s standardized denial metrics guidance explains why consistent definitions matter. Apply one method whenever the medical claim denial root cause analysis dashboard is refreshed.
Separate initial denials from final unresolved denials. The former records the payer’s first adverse decision; the latter remains unpaid or written off after follow-up and appeals. Track corrected or overturned outcomes separately. This lets medical claim denial root cause analysis distinguish problem frequency from recovery results.
Create a metric dictionary with each metric’s meaning, formula, source, inclusion rules, owner, and refresh frequency. Stable metric definitions make trend comparisons reliable. The medical claim denial root cause analysis dashboard should display or link to these definitions. Comparisons are valid only when definitions stay consistent.
Group Denial Reasons into Actionable Categories
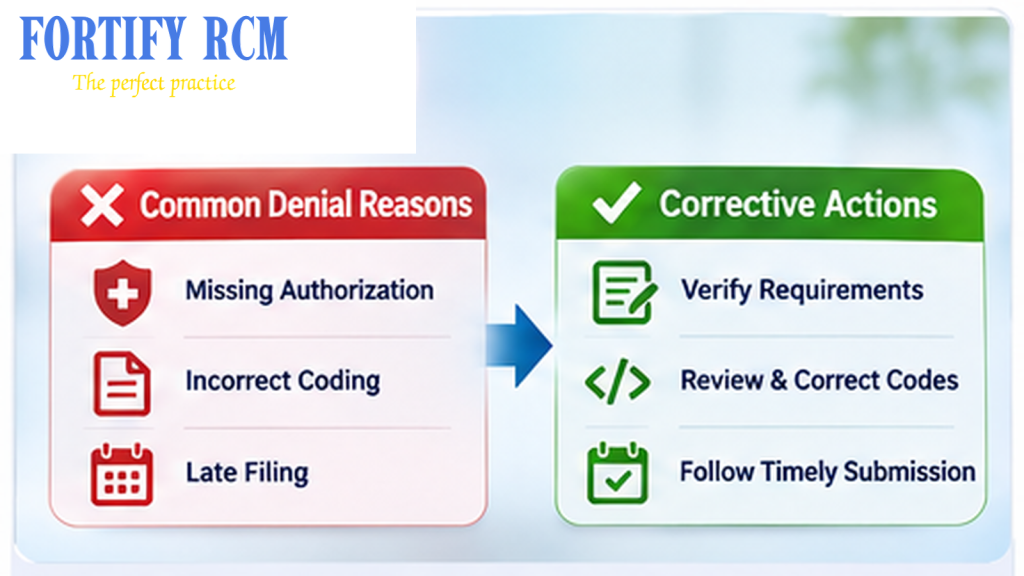
Translate payer reasons into categories with clear operational owners. Retain original codes and allow drill-down to claim level. This gives medical claim denial root cause analysis a bridge between remittance data and workflow causes.
| Actionable category | Examples | Typical owner |
|---|---|---|
| Eligibility / registration | Inactive coverage, incorrect member data | Front desk |
| Authorization / referral | Missing, invalid, or mismatched authorization | Authorization |
| Coding / billing | Diagnosis, procedure, or modifier mismatch | Coding / billing |
| Documentation / medical necessity | Missing or insufficient records | Clinical / coding |
| Timely filing | Claim received after payer deadline | Billing |
| Coordination of benefits | Other coverage or payer sequence issue | Registration / billing |
| Payer processing / contract | Pricing, bundling, or adjudication issue | Denials / contracting |
Keep CARC, RARC, and group codes where available. CMS explains that an Electronic Remittance Advice reports adjustment reasons at claim or service-line level using these codes. Review CMS guidance on health care payment and remittance advice. A management category must not replace the payer’s original reason.
Do not assign an internal cause from a short code description alone. Missing information may reflect a registration handoff or delayed clinical record. Sound medical claim denial root cause analysis connects the payer reason to the claim, remittance, portal, and workflow evidence.
Choose Dashboard Dimensions and Filters
Let users move from overall trends to operational questions with filters for:
-
Payer and plan: Compare payer products without mixing unlike populations.
-
Specialty and service line: Identify patterns by department or service type.
-
Provider and location: Find trends linked to a group, office, or facility.
-
Service and code family: Compare procedures and relevant code groups.
-
Reason and category: Drill from a management category to original payer codes.
-
Aging and status: Separate new, pending, appealed, overturned, upheld, and unresolved accounts.
-
Dollar value: Keep billed charges, denied amount, expected allowed amount, and recovered amount distinct.
Show the period and refresh time. Filter by service, submission, remittance, and denial dates. A payer filter supports denial trend analysis and a denial rate by payer view. Protect account-level data with role-based access.
Avoid crowding one screen. Show denied claims, dollars at risk, leading causes, resolution speed, and overdue actions. Use these views to guide medical claim denial root cause analysis from overview to account review. A medical claim denial root cause analysis view should answer these questions without requiring users to interpret every raw code. Secondary views should keep the medical claim denial root cause analysis report readable. Users should be able to trace each figure to source accounts. This makes medical claim denial root cause analysis easier to audit.
Track Core Performance Metrics

Use volume, financial, recovery, and workflow measures. Define denial dashboard metrics and compare like with like; these are core revenue cycle denial KPIs.
| Metric | Practical definition | Management question |
|---|---|---|
| Initial denial rate | Initial denied claims ÷ claims submitted in the defined cohort | How often are claims first denied? |
| Denial dollars | Denied amount using a stated charge or expected-payment basis | What is the financial exposure? |
| Remittance denial rate | Denied claims ÷ claims remitted under the selected method | What appears in remittance data? |
| Overturn rate | Initial denials overturned ÷ initial denials appealed, matched cohort | How often do appeals succeed? |
| Appeal yield | Dollars recovered ÷ dollars appealed, defined basis | What value did appeal work recover? |
| First-pass acceptance | Claims accepted on first submission ÷ claims submitted | How strong is initial claim quality? |
| Time to resolution | Days from initial denial to documented resolution | How quickly are accounts resolved? |
HFMA’s MAP Keys for revenue-cycle KPIs defines remittance denial rate as denied claims over claims remitted. It distinguishes volume and dollar measures. A medical claim denial root cause analysis dashboard must label each formula and keep trend definitions consistent.
For overturn rate and appeal yield, match the numerator and denominator to the same cohort. Show sample size beside percentages, especially for low-volume specialties or payers. That context is important when medical claim denial root cause analysis compares small groups. This improves reliability and prevents small counts from being over-interpreted. A medical claim denial root cause analysis review should document any change to the metric definition. Keep these performance measures distinct in the reporting model.
Prioritize Root Causes by Impact and Avoidability
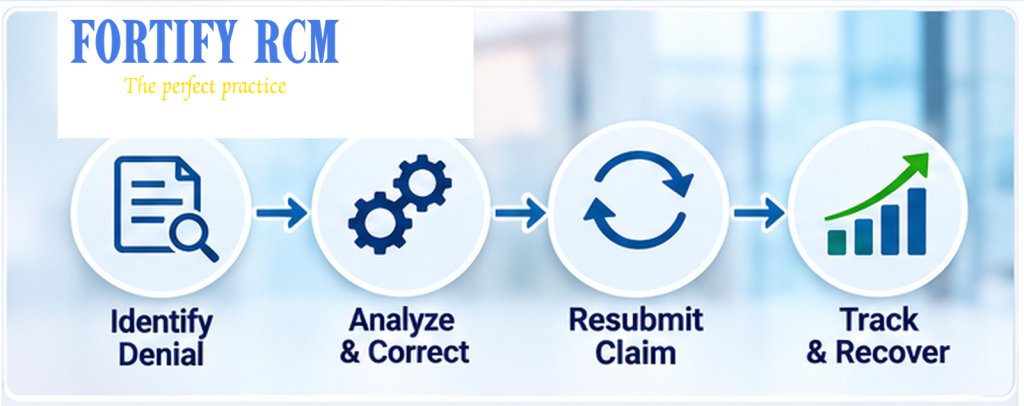
The largest category is not always the best first target. Prioritize by volume, dollars, avoidability, and deadline risk. High-value accounts near appeal or filing deadlines may come first.
Score categories from 1 to 5 for volume, dollars, avoidability, and urgency. Treat this as an internal tool, not an industry benchmark. Prioritize problems that are material and actionable. The medical claim denial root cause analysis dashboard can then rank causes by financial exposure and likelihood of correction.
Eligibility may affect many claims but have a low average dollar amount. Documentation may occur less often but involve high-value services. Payer-processing issues may have limited avoidability but substantial dollars requiring escalation. Show both count and financial exposure so leaders do not focus only on the tallest bar.
Create a “top five causes” view with category, payer, specialty, claim count, denied amount, age, owner, and next action. Use claim denial reporting to validate causes with sample accounts. Prioritize issues the practice can correct and flag payer disputes for escalation. A medical claim denial root cause analysis review should revisit priority scores as patterns change. The practical value is connecting a pattern to a controllable next step. This turns medical claim denial root cause analysis into a decision process.
Assign Corrective Actions and Set a Review Cadence

Assign Corrective Actions and Set a Review Cadence
Build a denial prevention workflow with clear ownership, due dates, audits, and remeasurement.
For each priority cause, record evidence, owner, corrective action, due date, audit sample, and remeasurement date.
Review monthly:
-
Validate data: Check completeness, duplicates, code mapping, and reporting dates.
-
Review trends: Compare periods using consistent definitions.
-
Select priorities: Choose a few high-impact causes.
-
Assign actions: Name an owner, due date, and expected process change.
-
Audit a sample: Confirm that the action is followed.
-
Remeasure: Check whether frequency, dollars, or resolution time changed.
The sample below is fictional, not client data or an industry benchmark.
| Illustrative category | Denied claims | Denied amount | Owner | Corrective action |
|---|---|---|---|---|
| Eligibility | 42 | $18,600 | Front desk lead | Recheck coverage |
| Authorization | 28 | $31,200 | Authorization lead | Add pending escalation |
| Coding | 19 | $12,400 | Coding supervisor | Audit frequent edits |
| Documentation | 14 | $24,800 | Clinical documentation lead | Add record checklist |
| Timely filing | 6 | $4,100 | Billing manager | Review claim aging |
Replace these figures with validated practice data; medical claim denial root cause analysis must connect reporting to accountability. A medical claim denial root cause analysis dashboard should make action ownership visible. Use medical claim denial root cause analysis in monthly reviews to confirm whether causes recur. A medical claim denial root cause analysis action log should record owner, due date, and remeasurement.
See CMS ERA and EFT operating rules and X12 external code lists. Retain code versions for historical interpretation.
Explore Fortify RCM services for eligibility, claims, denial handling, and follow-up, plus Claims Submission & Payment Posting services. Review results with billing, coding, registration, authorization, clinical documentation, and finance leaders.
Specialties We Serve
Denial patterns differ across behavioral health, ABA therapy, home health, occupational therapy, and physician groups. Fortify RCM supports billing and revenue-cycle workflows that need clear categorization, ownership, and reporting. A medical claim denial root cause analysis dashboard can be tailored to each specialty’s services and payer mix.
Mental Health Providers
Credentialing and billing for psychologists, therapists, counselors, and social workers in private or group practice.
Nutritionists & Dietitians
Specialized RCM and credentialing support for MNT providers, licensed dietitians, and wellness nutritionists.
Occupational Therapists
End-to-end billing and enrollment services for pediatric and adult OT clinics and independent therapists.
Non-Emergency Medical Transportation (NEMT)
We handle Medicaid credentialing, EDI setup, and claims billing for NEMT providers.
Home Health Agencies
Complete RCM services tailored for HHAs including Medicare credentialing, OASIS billing, and claims management.
Skilled Nursing Facilities (SNFs)
Credentialing, billing, and AR support for SNFs—compliant with payer-specific guidelines and long-term care needs.
Applied Behavior Analysis (ABA)
We support ABA therapy providers with credentialing, insurance billing, authorization and appeals for denied behavioral health claims.
Chiropractors & Physical Therapists
Credentialing and billing help for musculoskeletal therapy, rehab clinics, and solo practitioners.
Durable Medical Equipment (DME) Providers
We handle Medicare/Medicaid credentialing, EDI setup, and claims submission for DME suppliers.
Nurse Practitioners & Physician Assistants
Complete credentialing and billing support for NPs & PAs operating independently or in group practices.
Dentists & Oral Health Providers
Support with dental insurance credentialing and claims processing for general dentists and specialists.
Vision & Eye Care Specialists
Credentialing and RCM services for optometrists, ophthalmologists, and vision therapy providers.
FAQs
1. How should a medical claim denial rate be calculated?
Choose the unit—claims, claim lines, or dollars—and define the numerator, denominator, cohort, and time period. Use a consistent method before comparing results.
2. Which categories help identify denial root causes?
Use eligibility, authorization, coding, documentation, timely filing, coordination of benefits, and payer processing. Retain original CARC, RARC, and group codes.
3. What should the medical claim denial root cause analysis dashboard show?
A medical claim denial root cause analysis dashboard should show metric definitions alongside each measure. It should let managers compare denial categories, dollars, and time to resolution.
Include denial rates and dollars, overturn rate, appeal yield, first-pass acceptance, resolution time, payer, specialty, provider, age, reason, and status. Show refresh date and definitions.
4. How often should denial trends be reviewed?
A medical claim denial root cause analysis process should use a cadence that fits claim volume and payer deadlines.
Review urgent queues weekly and trends, owners, and corrective actions monthly.
5. How can medical claim denial root cause analysis guide corrective action?
Analytics finds patterns; account review confirms causes. Assign an owner, action, due date, audit sample, and remeasurement date.
6. What is the difference between denial rate and denial overturn rate?
Denial rate measures denial frequency under a defined formula. Overturn rate measures the share of appealed denials reversed for a defined cohort. They answer different questions and belong in separate dashboard metrics.
Turn Denial Reporting into a Practical Improvement Plan
A denial dashboard should help your team identify recurring causes, understand financial exposure, assign ownership, and measure corrective actions. Inconsistent reports or disconnected follow-up make it difficult to prioritize problems.
Fortify RCM can help practices review denial reporting, claim follow-up, and revenue-cycle workflows. A medical claim denial root cause analysis review can reveal gaps in metrics and ownership. A medical claim denial root cause analysis review can also identify unclear action ownership. Explore Revenue Cycle Management services and this guide to reducing medical claim denials. For a workflow review, contact Fortify RCM. A medical claim denial root cause analysis discussion can help identify practical next steps.